An SQCDP Board is a visual management board which quickly conveys how you are performing in key areas. Specifically, the areas are Safety, Quality, Cost, Delivery, and People. Place the board near the team to help collaborate, monitor and use the information to direct improvement activities.
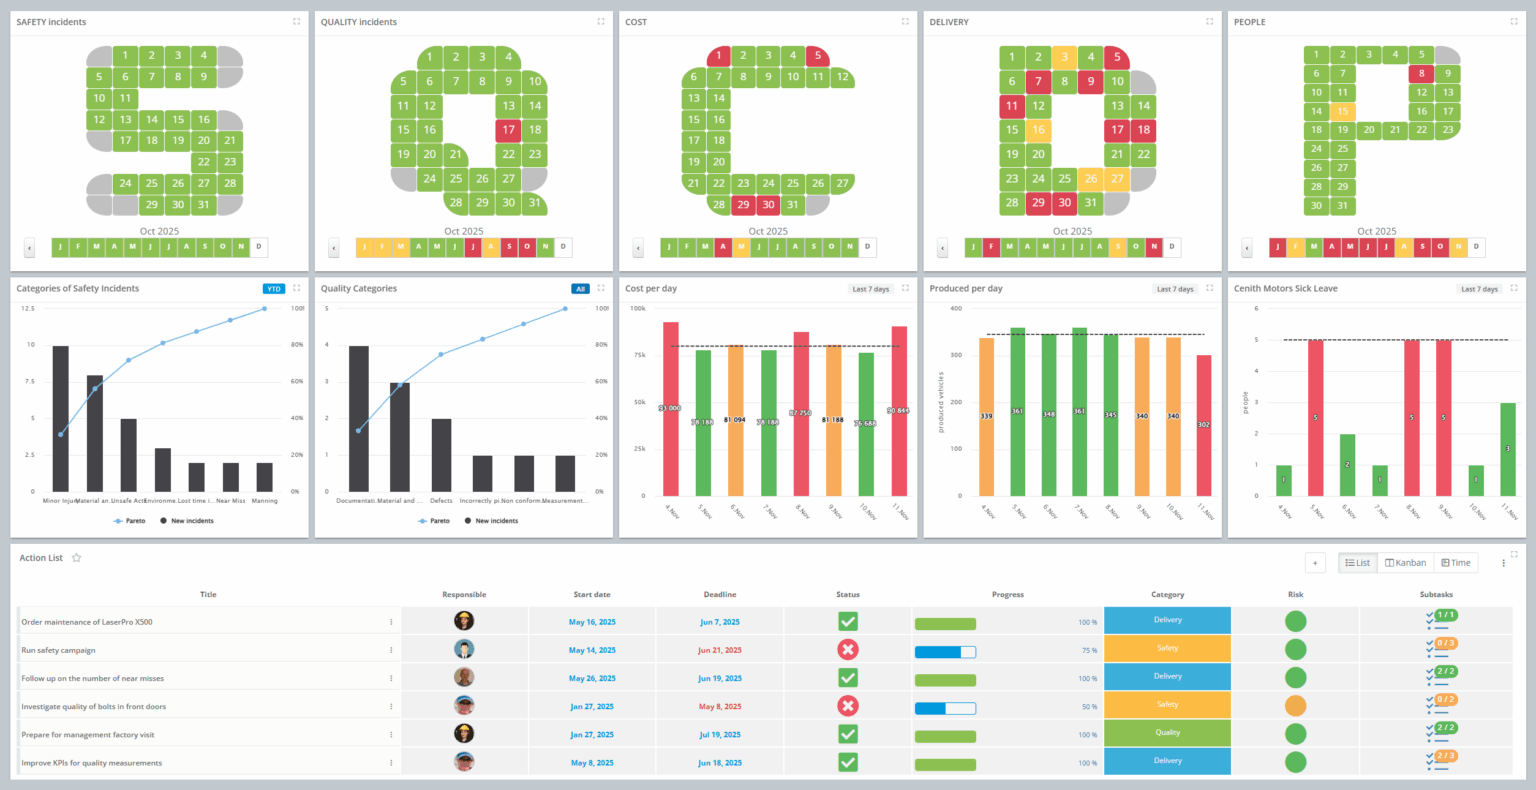
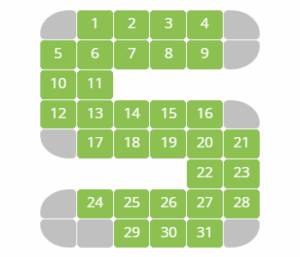
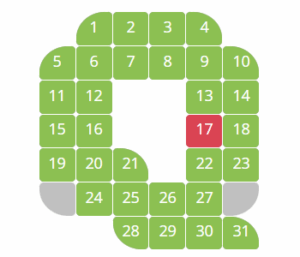
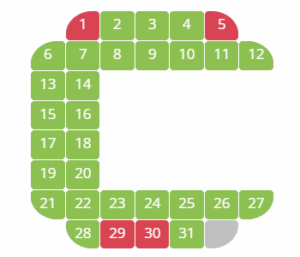
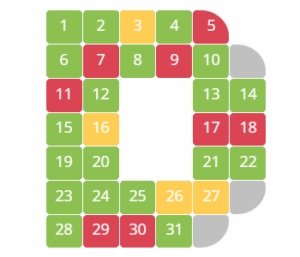
The SQDCP board offers a fast, visual overview of daily performance, highlighting success and failure based on specific criteria. Each tracking area has a letter with 31 numbers inside, representing each day of the month. At the end of each day, the team evaluates the performance for each area and colors the day according to result. Green represents goals met, and red represents the opposite, indicating errors that need attention.
Follow these steps to start with SQCDP boards:
Identify your key metrics across Safety, Quality, Delivery, Cost and People.
Here are some SQCDP metric examples:

Placing the board strategically close to the team is a significant contribution to sustaining the daily attendance. This creates ownership rather than belonging to someone else.
At the end of the day, the team evaluates the performance according to the metrics defined in Step 1. The cell is green if you meet the criteria and red if not.
Discuss and add countermeasures for areas that need attention.
Evaluate trends. At a glance, one can see which areas are succeeding and which need support. If the red status continues despite corrective actions, evaluate and take additional action.
Use visual tools
A diagram, such as a Pareto Chart, can be useful to identify problems. This chart is a Histogram, sorted from the largest frequency to the lowest.
Identify causes
When you’ve identified a problem area, the next step is to find out why. This should naturally lead to the rest of PDCA. Some will lead to larger Kaizen events, meriting an A3.
However, most improvements should be addressed as part of daily work – integrated into the normal flow of doing the job.
Successfully implementing Visual Management will come with a number of benefits, including:
| Improve Productivity | Keep your workforce organized and productive and prevent slipping back into Business as Usual |
| Improves Accountability | Daily visibility of errors and unmet standards makes it easy to see where accountability belongs. When the board is placed in a public space, it encourages teams to stay focused, work smart and achieve targets |
| Promote Values | Enact your values and make them part of the culture of your working environment |
| Impress Clients | Show clients that you invest in continuous improvement and maintain clear performance standards |
Many organizations tailor the classic SQCDP format to better reflect their operational focus. While SQCDP is widely recognized, it’s not the only performance-tracking structure – and DigiLEAN supports all these variations so you can align the board with your specific priorities.
Common alternatives include:
PSQDI, SQDC, SQDIP, SQCDPI, SPQDC, SQDCP, SQCDPE, SQDICP, and SQPDC.
Each of these formats provides a structured way to drive daily management, maintain clarity on key metrics, and support continuous improvement.
DigiLEAN allows you to fully customize your digital boards and save them as a SQCDP board template that can be used consistently across your organization. You can choose any KPI letter combination from the app library to ensure the board reflects your unique processes, metrics, and internal terminology.
Design your ideal performance-tracking layout and store it as your SQCDP board template for easy reuse and standardization.
Manual boards often lose their data at the end of the month, making long-term analysis difficult. A digital SQCDP board provides live updates, ensuring that any deviation reported in your processes is immediately visible to the entire team. Instead of waiting for manual updates or end-of-shift reviews, issues are captured and shared in real time – speeding up response and resolution.
Because all deviation data is logged continuously, you also get instant access to historical records, trend analyses, and performance patterns. Nothing is lost at the end of the month, and your improvement efforts are fully traceable.
This real-time transparency strengthens decision-making, enhances cross-team collaboration, and gives you a clear, data-driven foundation for continuous improvement.
There are many ways organizations adapt the SQCDP structure to fit their operations. Below are a few SQCDP examples used across different industries:
Manufacturing: Tracking safety incidents, product quality, daily output, equipment downtime, and performance.
These SQCDP examples highlight how flexible the format is and how it supports clear, structured daily performance management.
You can watch DigiLEAN boards DigiLEAN boards intro video to deepen your understanding of digital SQCDP boards, book a demo to walk through the workflow with an expert, or see digital SQCDP boards live by starting a free trial and exploring the platform yourself.