Traditional lean boards are widely used as visual performance management, but require a lot of time and attention to keep up-to-date. Outdated boards results in unproductive team meetings.
Visual performance management with DigiLEAN adds transparency to your operation. Use less effort to keep your boards up-to-date. It allows for a better workflow combining KPIs and dynamic action lists.
Kanban is the most common visualization tool. A kanban board visualize your activities. Move the activities across the columns from left to right to drive progress from start to finish. Each column represents a status, and the workflow is easily customized.
Where kanban boards focus on processes, time boards and weekly boards focus on time. Depending on your pace of operations, use a time board with a mohtly or annual perspective, or a weekly board.
Key performance measurements are metrics telling you where you are on the path to hit your targets. Visual management is all about “status at a glance”. Looking quickly at the board should intuitively tell you how well you are performing; Good, bad or somewhere in between that needs attention.
A good example are the traffic light indication giving you green light, amber or red light. These traffic lights are used to indicate custom indicators.
A good example are the traffic light indication giving you green light, amber or red light.
Moving beyond the KPI state, add numbers to quantify the status. How far away from targets are we? And how much further do we need to go?
Statistical graphs, numeric values combined with traffic light colors gives you the extra level of information.
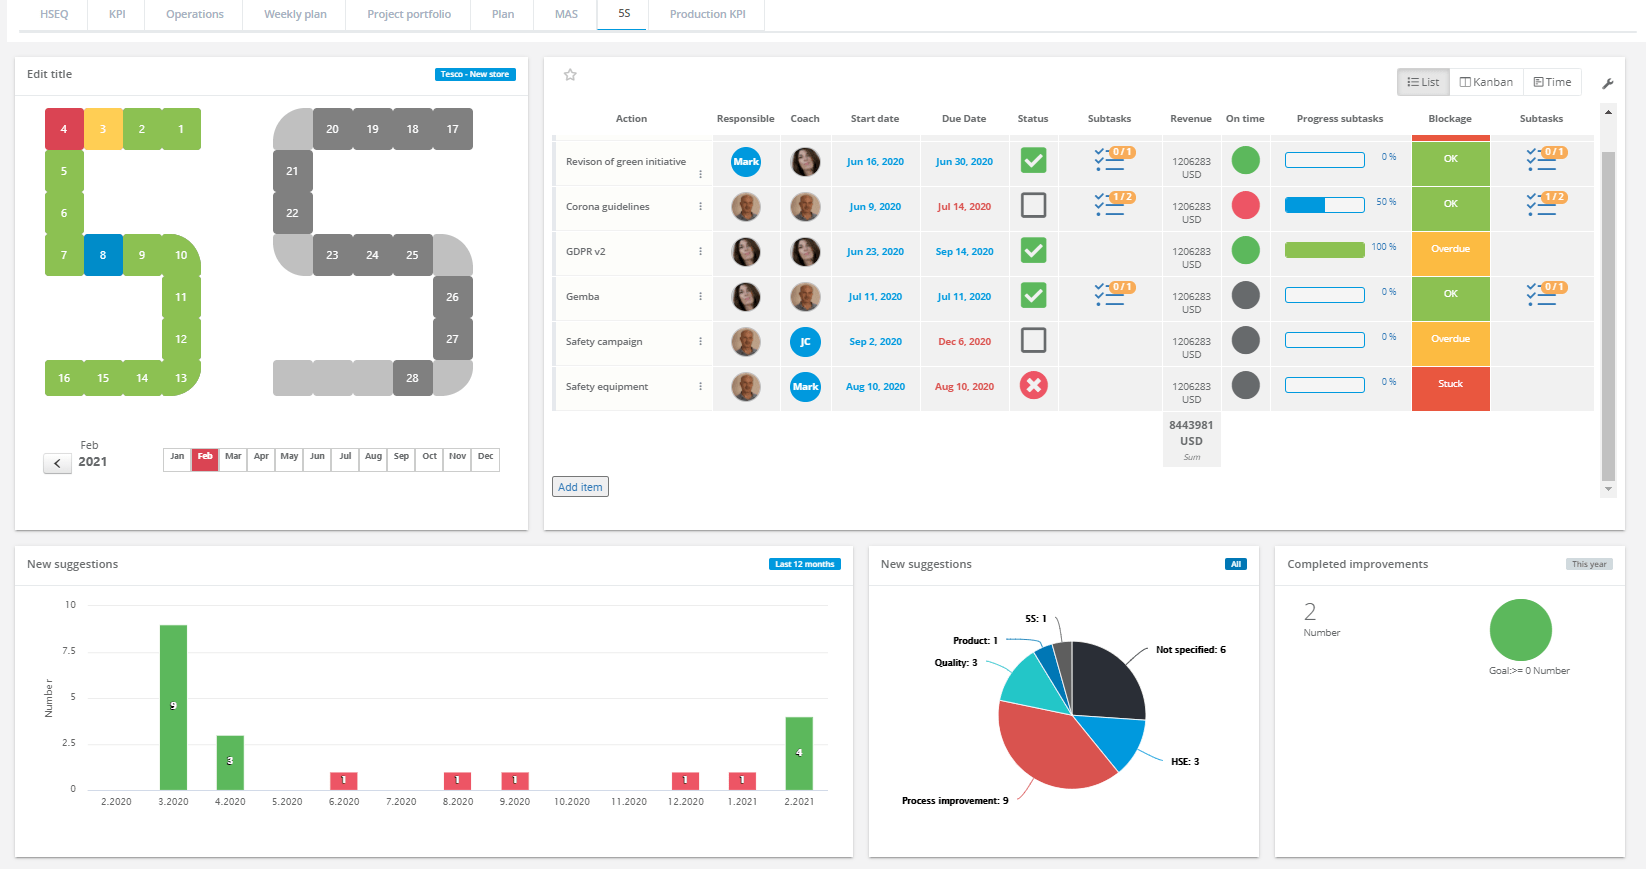
Many start their lean journey implementing a 5S standard. It’s about improving, sorting and standardizing your work place to increase workflow and reduce non-productive-time.
Often the 5S standard degrade without continuous attention. This is a good example where visualization really helps keep the attention to the 5S. Embracing visualization gives you engaged and committed employees.
Visualizing your daily activities and goals has a huge effect on your performance. It does, however, require regular usage. If it’s part of the daily agenda, it’s part of the employees’ mindset. Repetition and continued focus is a key part of change processes and building a culture.
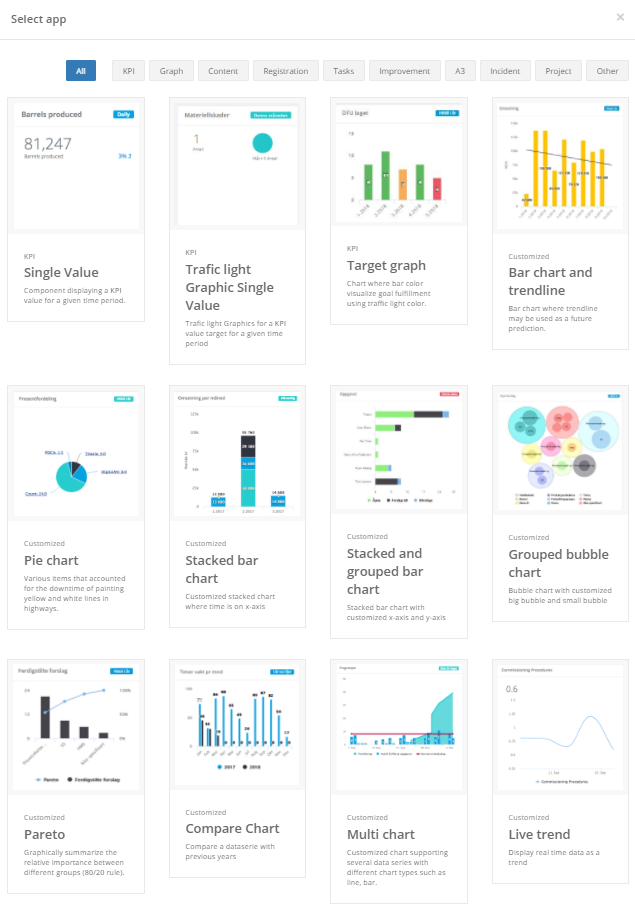
Use the built-in designer tool to customize your boards and make them relevant. The dashboards offer a large range of apps to use. Some apps visualize KPIs while other are interactive. Interactive apps, such as 5S or green cross let you report status directly on the boards.
Define your KPIs in DigiLEAN. One way to use it is to update KPIs directly from the board. Another way it is to visualize external data such as Excel or any integrated 3rd party system.
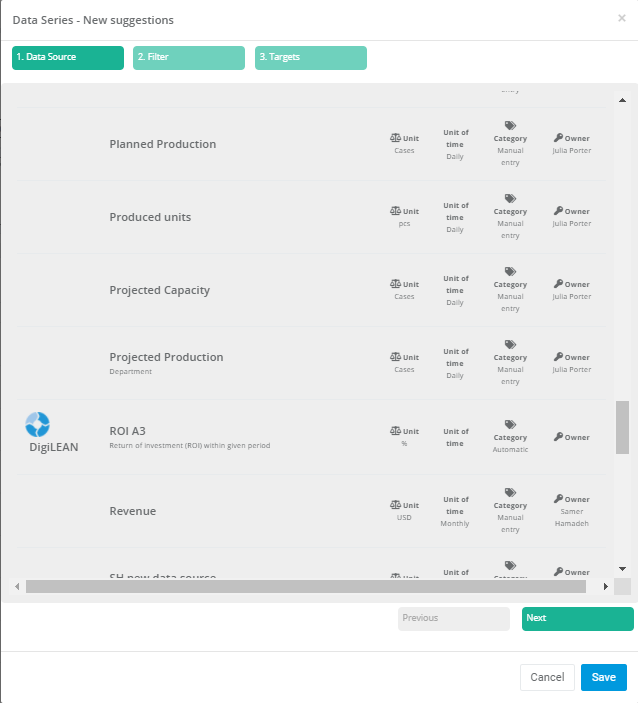
Add your periodical targets for each mesurement. This is being used in visualization apps where green, yellow and red are applied automatically according to your target settings for that KPI.
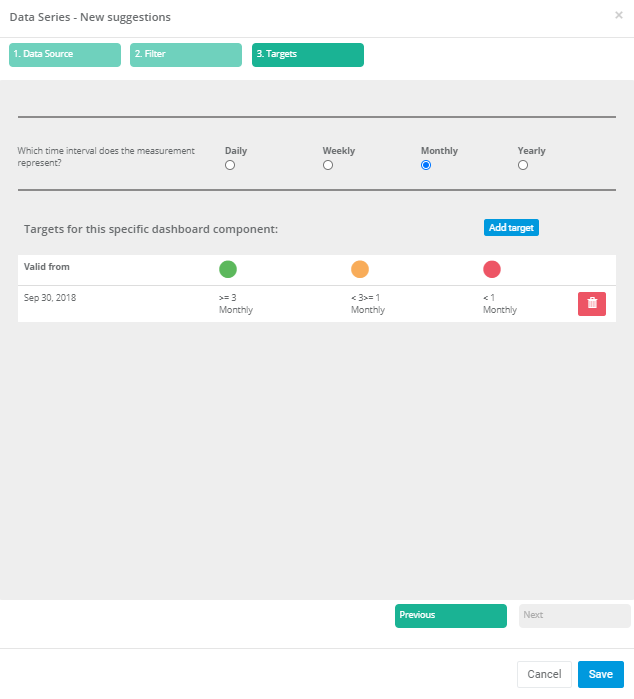
The selected app decides how you want to visualize data. Connect each app to a measurement and the board will always display updated values.
Combine different presentations with filters and sorting to create a more nuanced insight for your team.
Don’t let digital boards be eye-candy only. Stay interactive with your team and the boards. Our data registration apps lets you report performance measurements on the board. Any visual representation of the measurement updates in realtime.
Getting data through an integration with a 3rd party system gives you the visualization offered by DigiLEAN.
So what do you achieve with DigiLEAN?