As value stream mapping covers the whole chain of events, you need to involve discipline leads covering the whole process. It’s also important that this is a committed team effort, because improvements coming out the other end must be implemented by each of the disciplines.
Products may have different processes, but if the processes are pretty much the same, you can create a map covering all of them.
A method to identify your products, processes and similarities is the process family matrix. The process family matrix helps you identify which products share most of the processing steps, and thereby can be mapped as one.
In some cases, you identify unique facets requiring individual process maps.
This is not an exercise done only on paper. As the value stream map is formed, it needs to be validated. Is the work and processes the way we think?
Time for a Gemba, do interviews with frontline workers and collect key information about from the process.
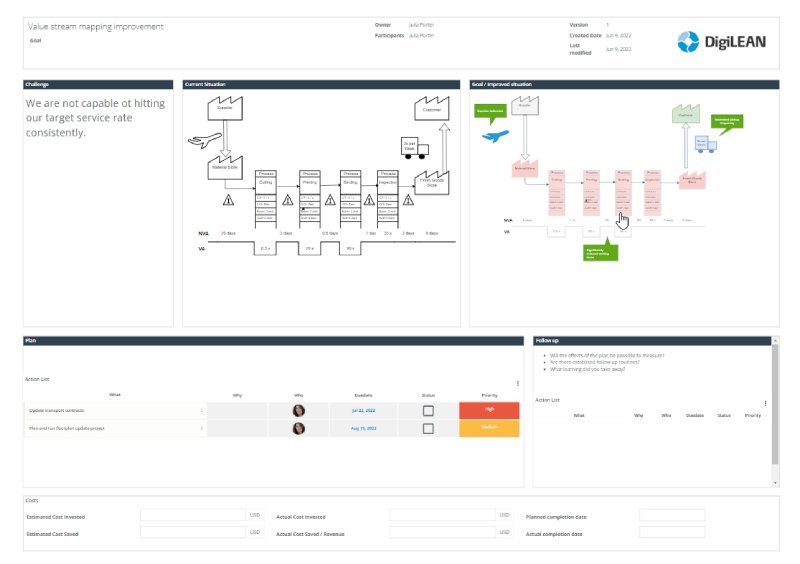
Example given:
The outcome shall be a decent coverage of the current processes and enable you to identify problems and improvement areas.
How are you measuring the improvements?
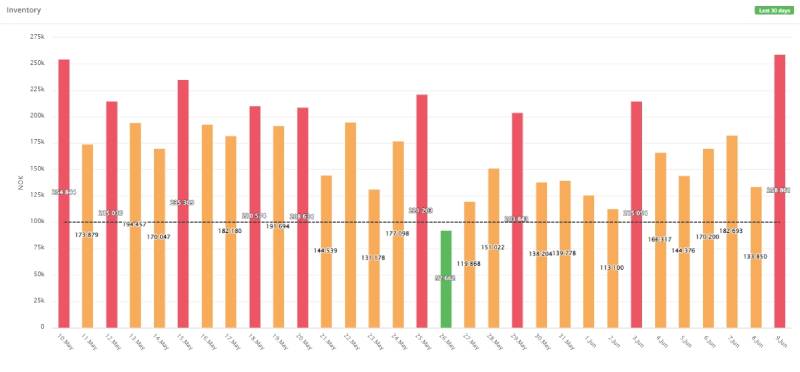
Normally, your KPIs such as throughput, produced units or service level are used to track the overall performance.
Takt time, lead times, cycle times and OEE are secondary, but still important to manage.
Base lining your performance is necessary to measure the effects.
The analysis shall then focus on the value stream, where you and the cross-functional team is studying all phases of the production to identify improvement potentials.
How do you determine value adding activities?
Put yourself in the minds of the customers and agree how your products adds value to them. Then you can identify how and where in your production process the value is added to your products.
Using the 8 wastes checklist is a great way to identify other process related improvements:
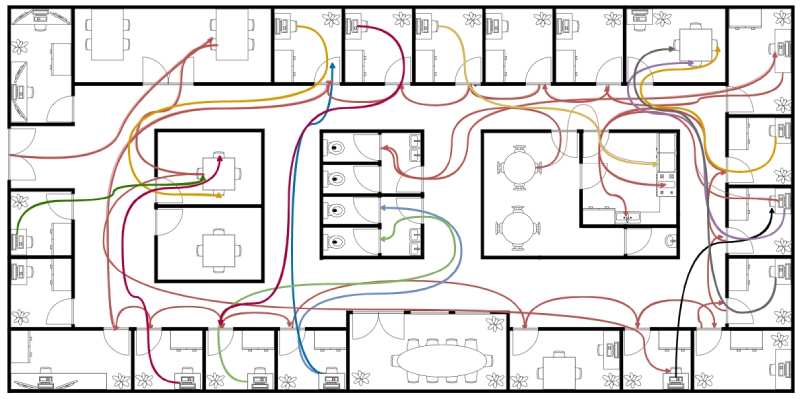
Unnecessary movement of materials, information or equipment is increasing lead time and cycle time without adding value.
A method to improve this is to rearrange placement and location of materials and equipment. Use a spaghetti diagram to create an overview of the movement and visualize how to improve the floor plan.
Making more of something – making it earlier or faster – than it’s needed.
Batch production reduce the overall efficiency and causes increased inventory and WIP levels.
Optimize your production flow to meet customer demands in terms of product quality and quantity.
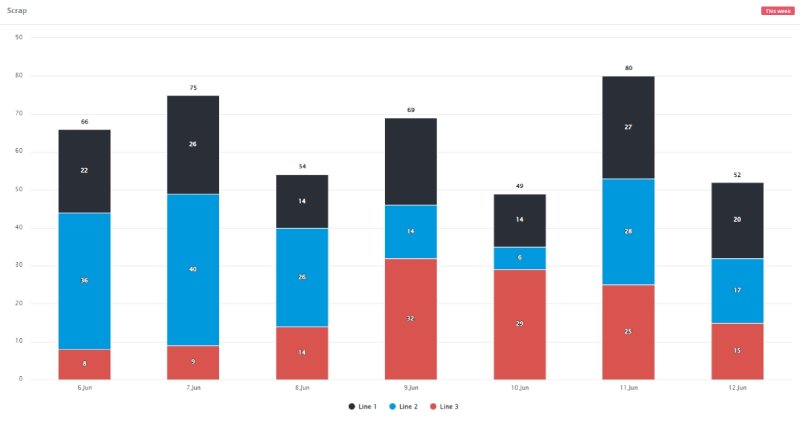
Any production should work against zero defects. Any defect is directly affecting production, causing rework and/or delayed delivery to the customer. It disrupts the production flow and causes ripple effects down the line.
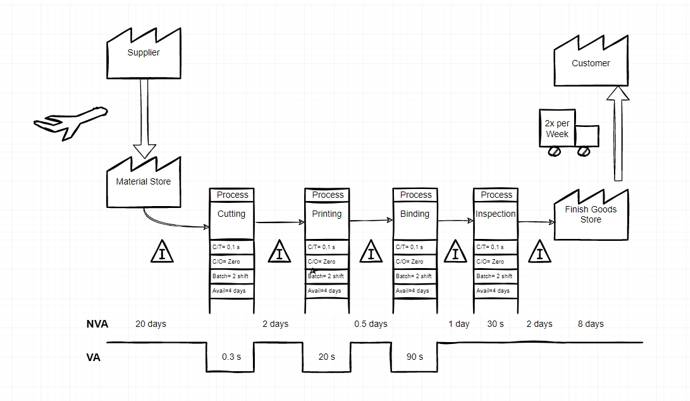
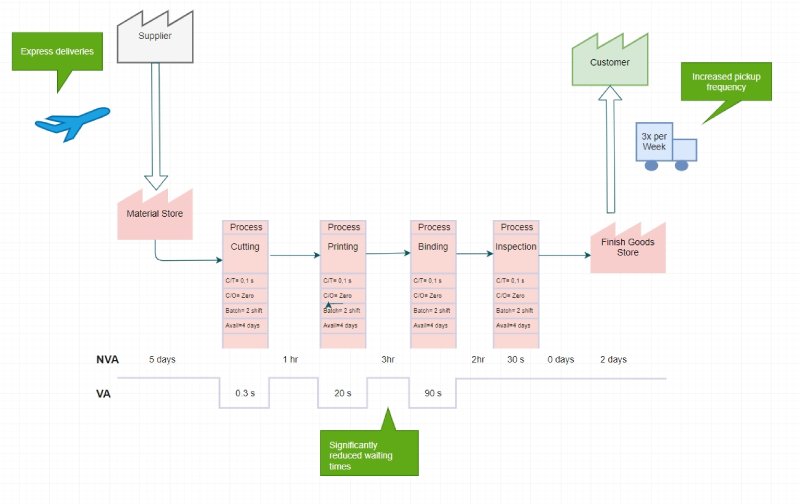
From a value stream map, waiting times are the most visible wastes. You can see between each production step the time spent on waiting for the next step. Reasons can be waiting for information, equipment, materials, parts or people.
Create a new version of the value stream how you would like it to be. Don’t consider whether this implies big and small changes. This exercise is intended to visualize a perfect world and act as a guiding star for the next step.
It’s possible in many cases to create a simple action list, if the improvements are simple enough.
On the other hand, using A3s and the Toyota Kata principles is very suitable in this process.
Not all the improvements are very clear, either in terms of how to make them, or if they will give you the expected results. In this case, doing A3s and experimental actions, closely tracking metrics, actions and effects is key to make it right.
As an example, you will have one A3 per improvement project, and numerous A3s for the whole value stream improvement. Each of them may provide their expected results, such as improved cycle time, reduced waiting, reduced takt times, but overall, it’s also useful to monitor the production KPIs.